From an export to segments in one evening

Four steps. The first two happen on the day you connect; the third takes as long as writing the email does.

  1. Connect your data

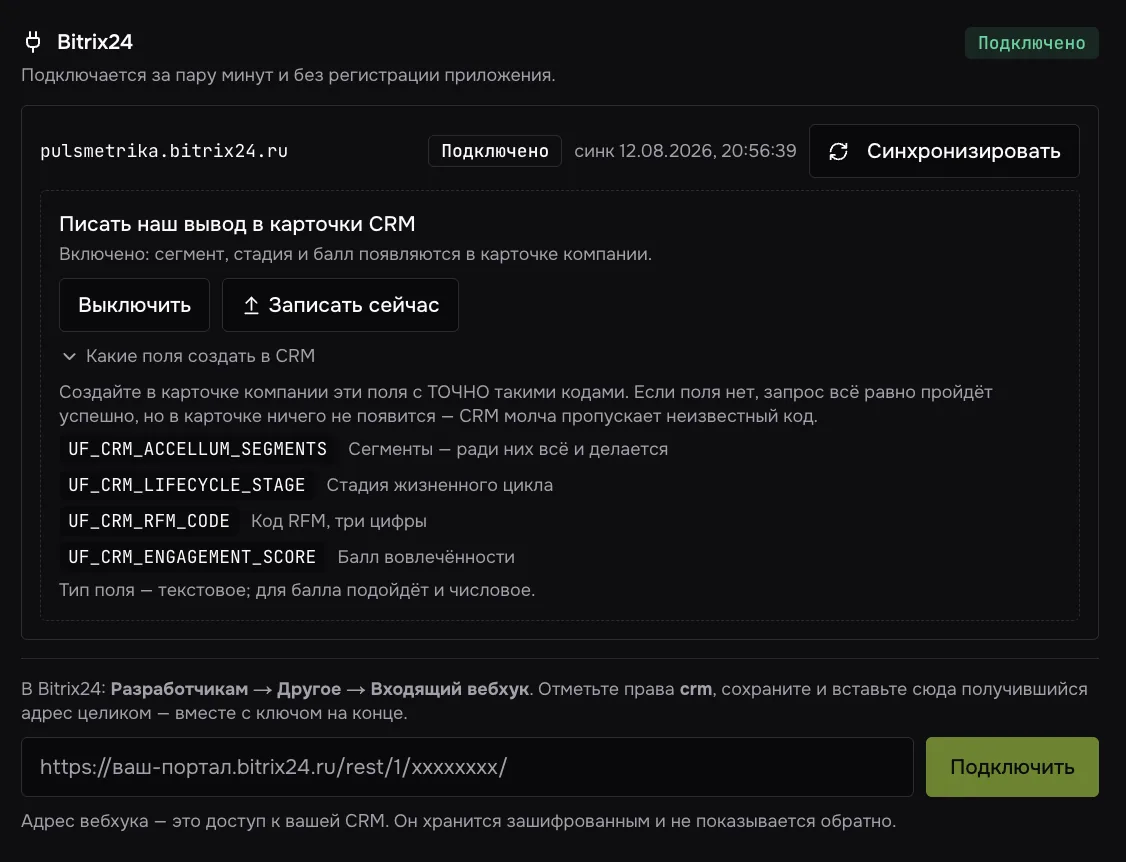
    A CSV export, or Bitrix24 over an inbound webhook: the portal hands over companies, contacts and deals. Column mapping is remembered and a second upload extends the base instead of duplicating it. amoCRM is connected on request: OAuth needs an application registered on our side.
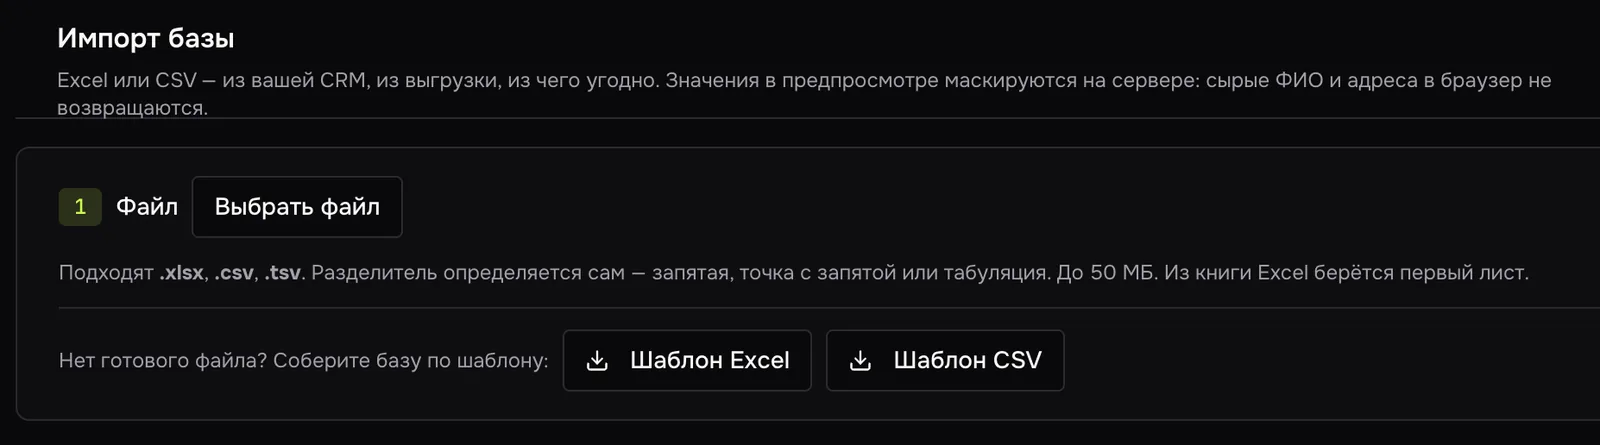
    The import screen: choosing an Excel or CSV file, a hint about the delimiter and links to templates.
    A product screen. The data is from a demo workspace.
  2. Get your segments

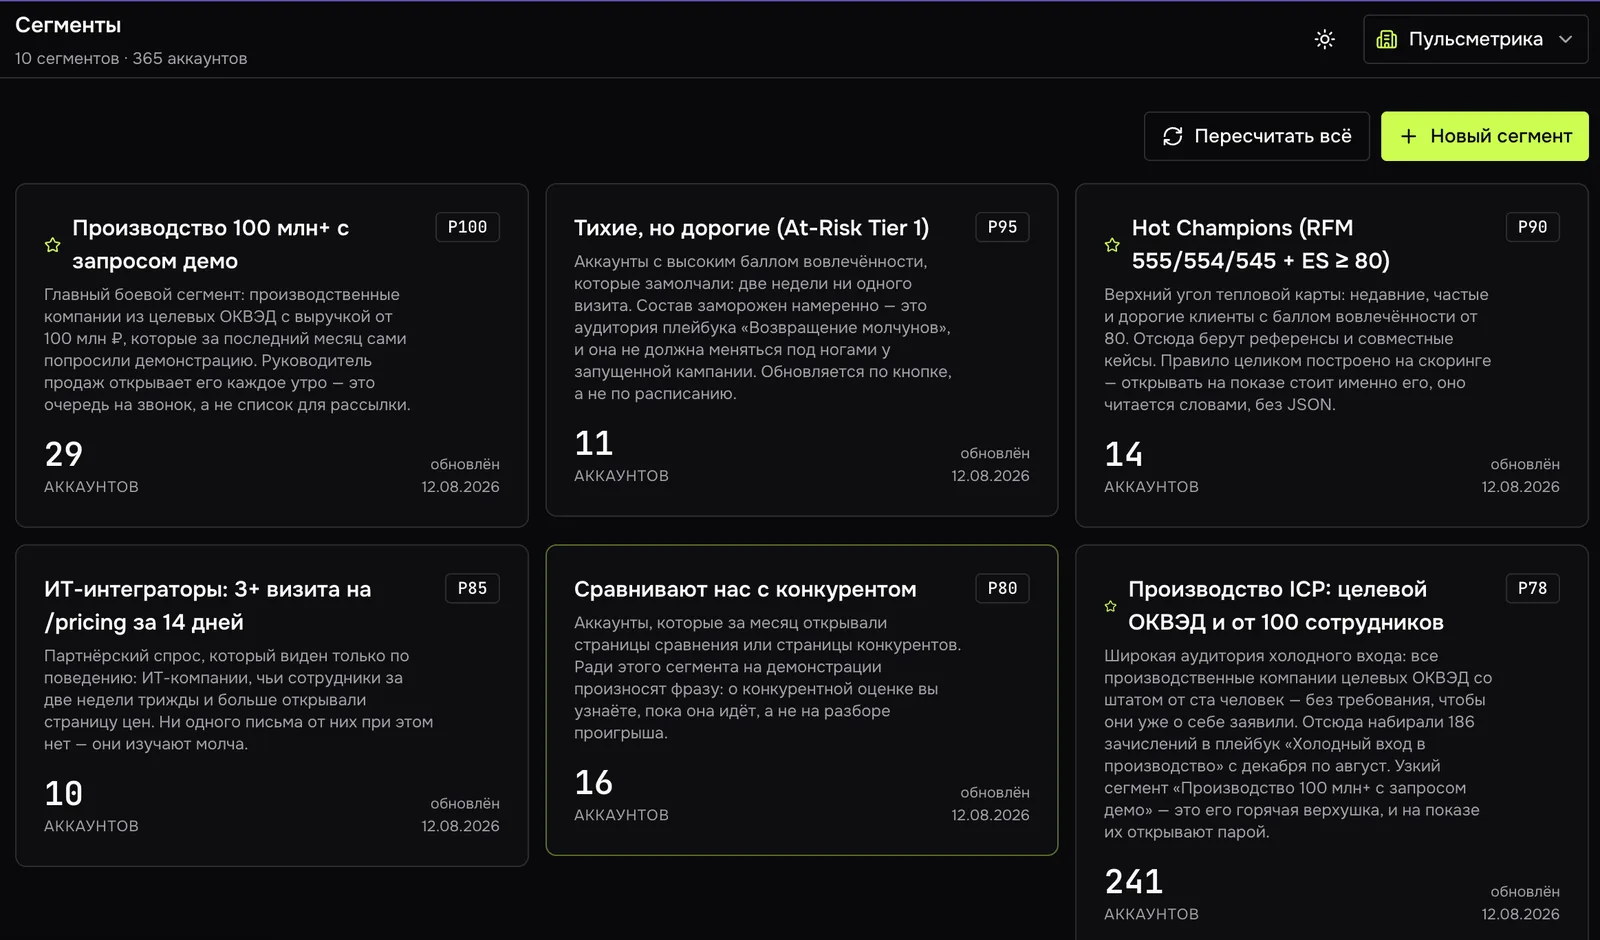
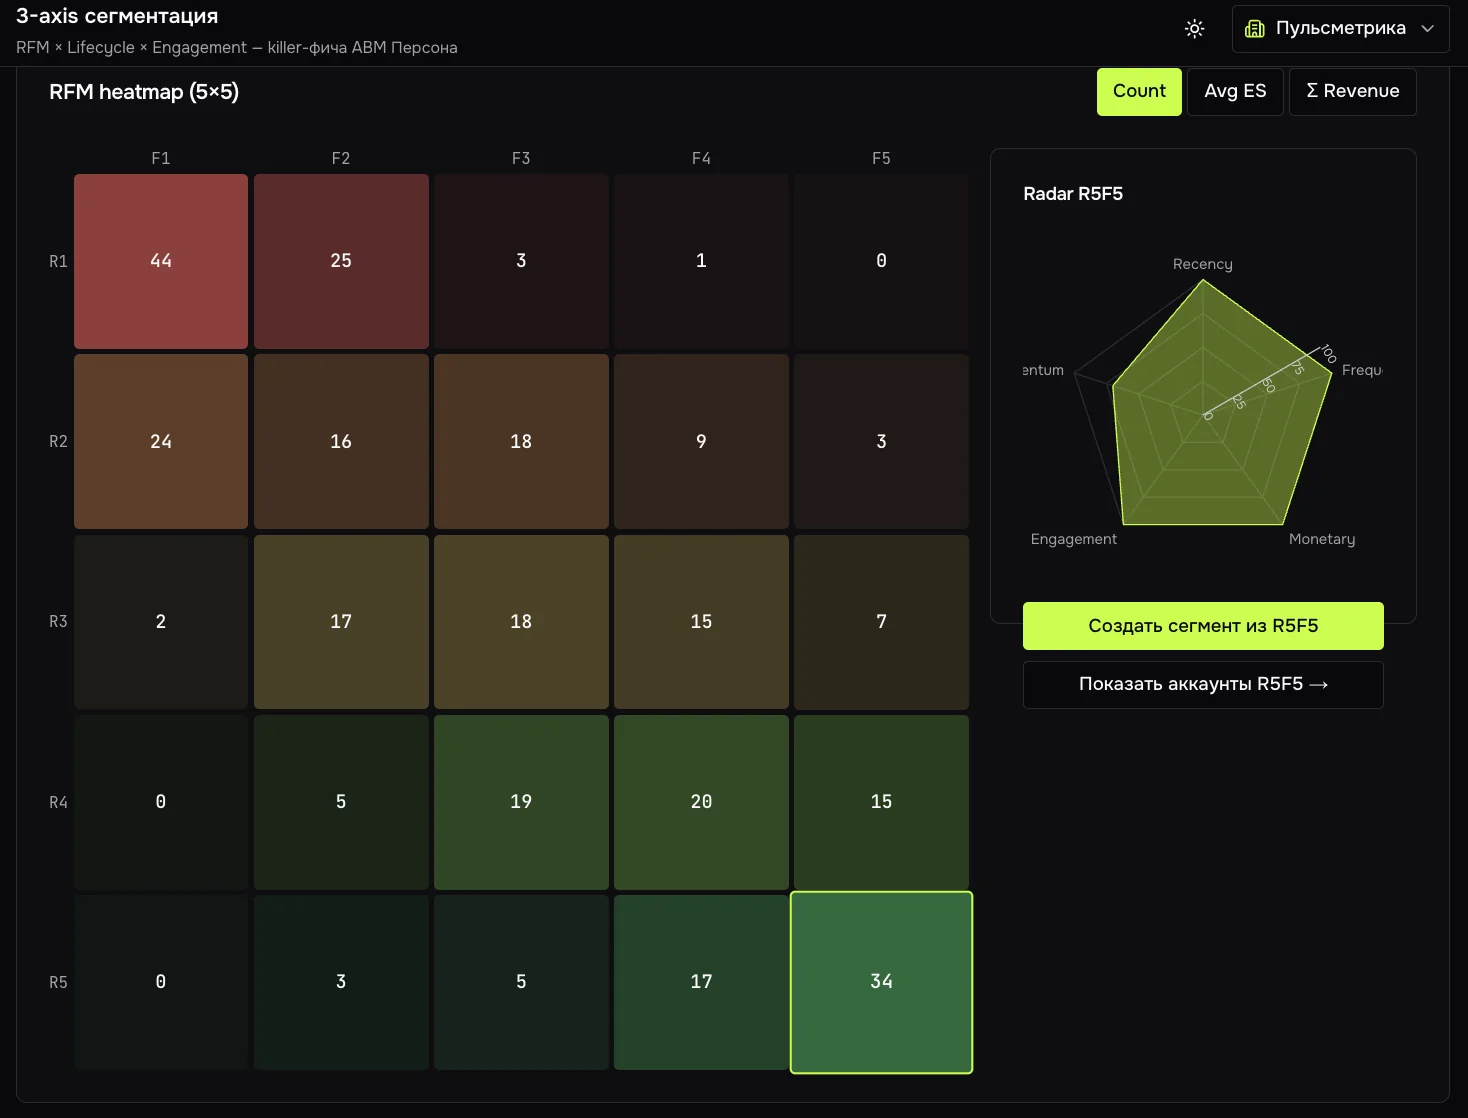
    Three axes are scored together: RFM by recency, frequency and money, the lifecycle stage, and engagement from events. The result is 5-7 segments with plain names, not a table of scores.

    The segments screen: six cards with names, the rule behind each and the number of companies in it.
    A product screen. The data is from a demo workspace.
  3. Launch a playbook

    A three or four step scenario with delays and conditions runs on a whole segment. Two variants of one step compete: traffic shifts to the better one and significance is computed for you.
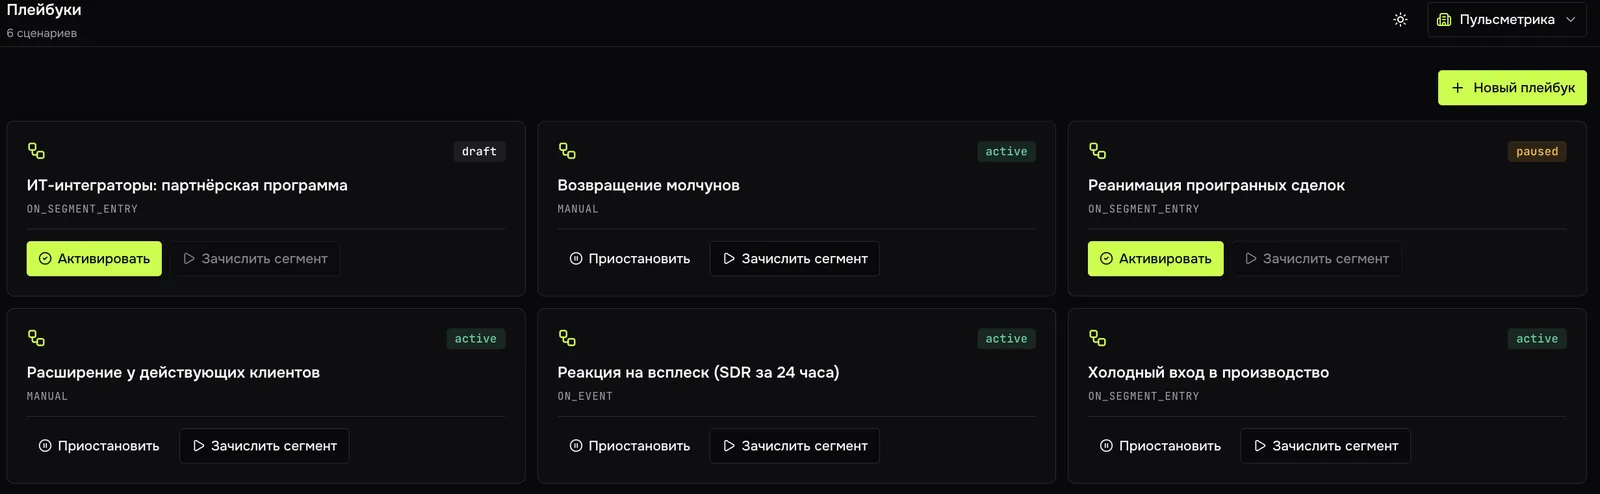
    The playbooks screen: six scenarios with their state (draft, active, paused) and buttons to run them on a segment.
    A product screen. The data is from a demo workspace.
  4. Watch engagement

    The counter goes into your site with one line and reports pricing visits, downloads and repeat sessions. Those events raise the account's engagement and move it between segments.
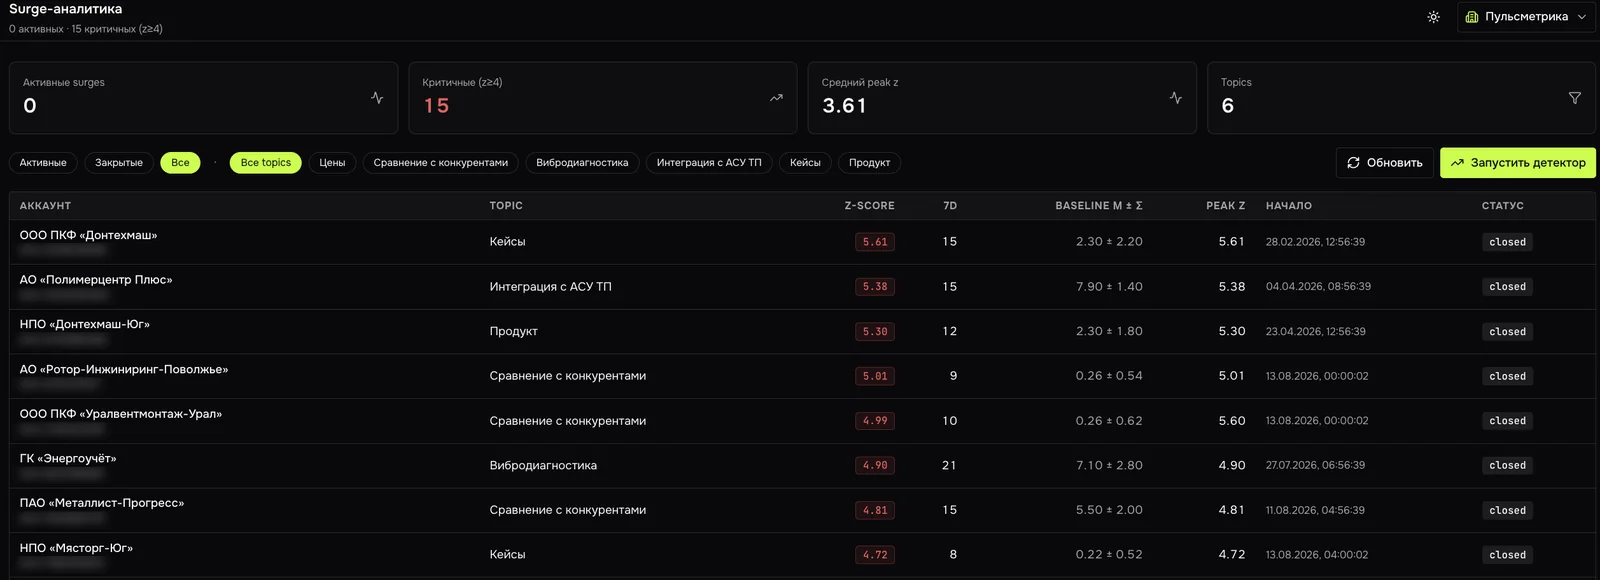
    The activity surge screen: a table of companies with the topic of interest, the surge z-score, events over the past week, the baseline and the start date.
    A product screen. The data is from a demo workspace.

Product screens

Four screens a person sees in the first week. None of them was drawn for this website.
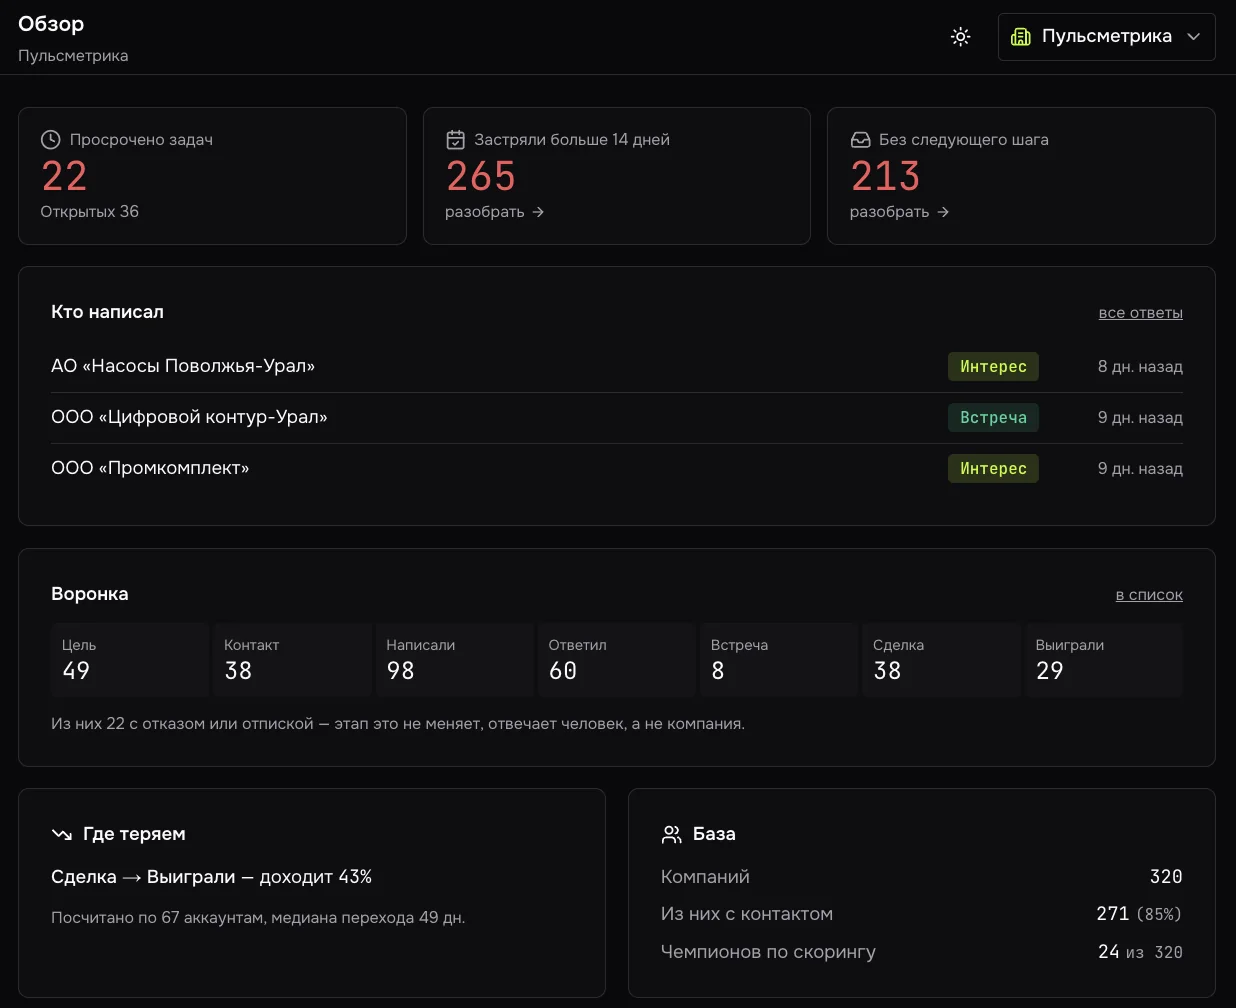
The overview screen: overdue tasks, stalled deals, the latest replies from companies, the funnel by stage and a base summary — 320 companies, 271 with a contact.
A product screen. The data is from a demo workspace.
The first screen of the workspace: what is overdue, who replied, where the funnel stalls and how large the base is.
The three-axis screen: a five-by-five RFM heat map with company counts, a radar chart for the selected cell and a «create a segment» button.
A product screen. The data is from a demo workspace.
All three axes at once: a cell shows the number of companies, the radar shows its profile, and one button turns it into a segment.
The activity surge screen: a table of companies with the topic of interest, the surge z-score, events over the past week, the baseline and the start date.
A product screen. The data is from a demo workspace.
Activity surges: which companies show interest above their own usual level, and on which topic.
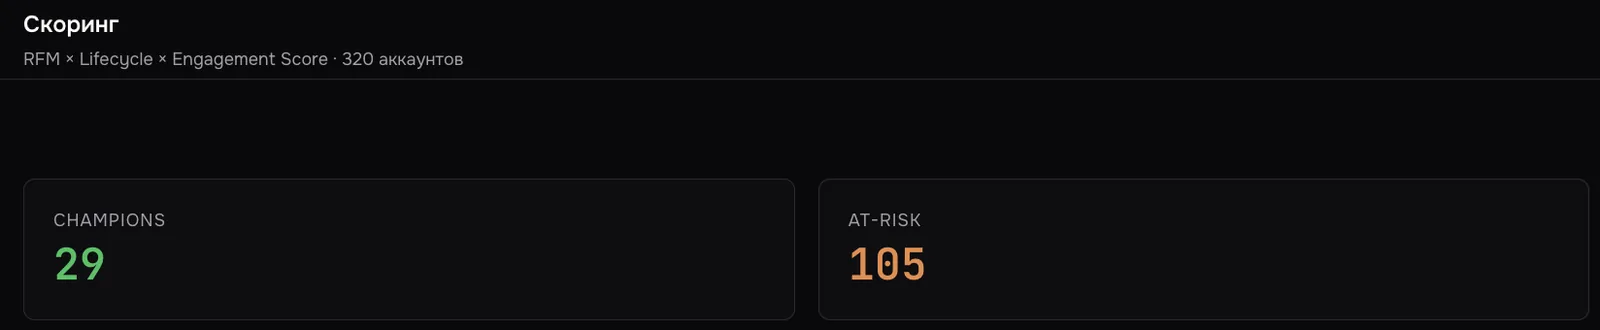
The scoring screen: the line «RFM × Lifecycle × Engagement Score, 320 accounts» and two counters: 29 champions and 105 companies at risk of churn.
A product screen. The data is from a demo workspace.
The three-axis summary: how many champions and how many companies are at risk across the base.
The Bitrix24 connection screen: the portal is connected and write-back of segment, stage and score into the CRM company card is on.
A product screen. The data is from a demo workspace.
The Bitrix24 connection: segment, stage and score are written back into the company card in the CRM.
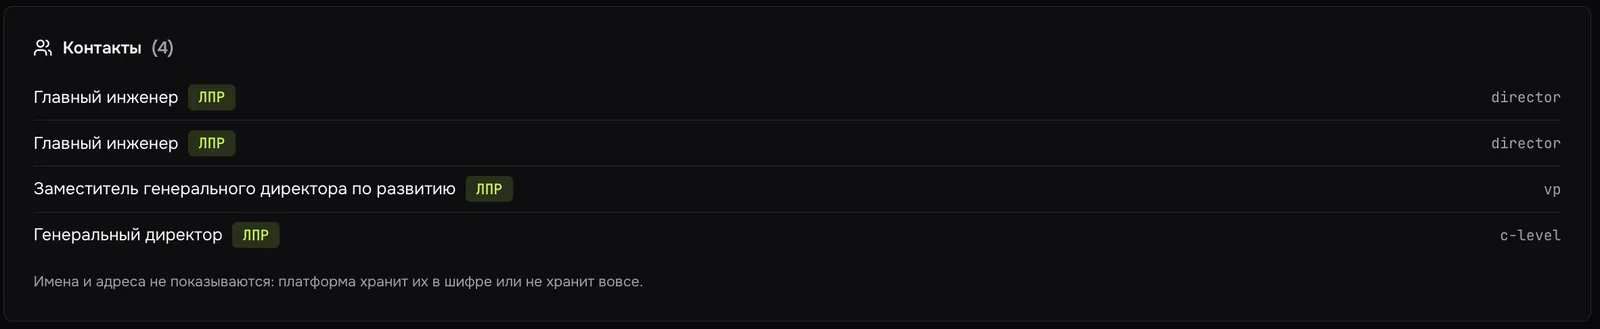
A company card contact list: only job titles and the buying role are shown, names and addresses are not.
A product screen. The data is from a demo workspace.
A company card: job title and buying role are visible, names and addresses are not shown even inside the product.

What next

Access opens on request: we reply within one business day, show the product on your data and set up access: 100 companies, all three axes and one playbook.